E-commerce is evolving and growing in Australia’s business landscape in 2025. With the advent of convenient and contactless shopping, knowing the latest industry figures is crucial to stay on par with your competition.
We have compiled the latest Australian eCommerce statistics for 2025 to keep you informed about rising trends and data-driven consumer behaviour.
Australian eCommerce Shoppers Statistics
The shift towards work-from-home policies and movement restrictions drove Aussies towards retail therapy. In 2020, online shopping became a means to kill boredom, leading eCommerce traffic to record-high figures.
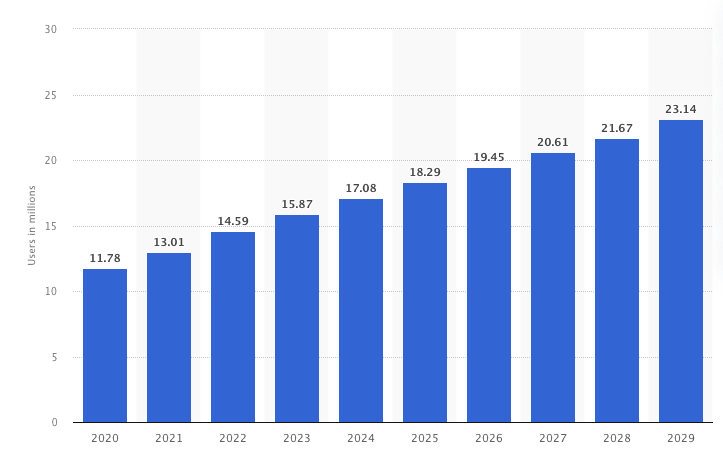
Fast forward 4 years, and eCommerce has been well-accepted and integrated into the lives of Australians as a go-to means of shopping. In 2024, 17.08 million Australian shoppers used online shopping websites monthly, a 45% increase from 2020 (11.78%).
Putting that into perspective, Australian eCommerce shoppers account for roughly 63.94% of the country’s 26.714 million population.
Source: Statista
As the number of eCommerce users continuously increases, it’s forecasted that there will be roughly 23.14 million online shoppers by 2029—a 96.43% increase between 2029 and 2020.
The 2024 Global Digital Insights by Hootsuite and We Are Social about Australia’s eCommerce landscape showed that:
- 52.8% of internet users purchased goods or services online (0.1% YOY);
- 23.1% of users bought groceries in an online store (2.2% increase from 2022);
- 19.5% of customers consulted a price comparison website before making a purchase (0.3% increase from 2022);
- 13.5% used a buy now pay later service for their online transactions;
- 11.6% of Aussies bought a second-hand item via an online marketplace (-1.5% decrease from 2022);
Free Delivery services remain the primary driver for eCommerce purchases among 66.50% of internet users aged 16 and 64. Other effective sales drivers include:
- Discount and cashback coupons: 40.70%
- Hassle-free return service policy: 39.3%
- Loyalty rewards and points: 33.5%
- Simple online checkout: 33.5%
- Positive customer reviews: 32.1%
Australian eCommerce Spending Statistics
Australian eCommerce spending in 2024 skyrocketed to another record high of AU$56.07 billion, with fashion products remaining at the top spot with AU$11.64 billion in sales.
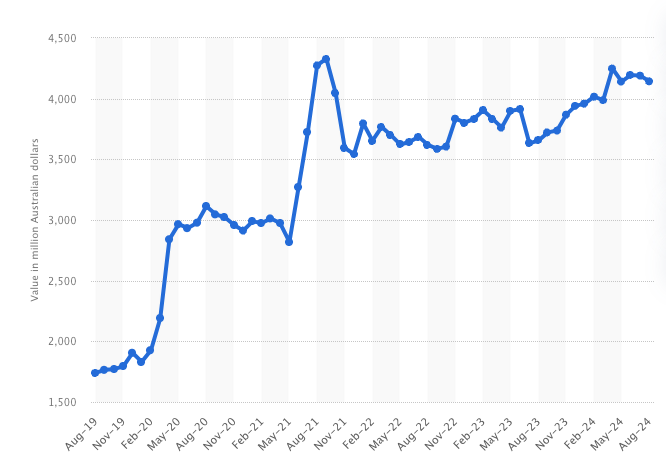
In August 2024 alone, Australia recorded a total online retail turnover of $4.143 billion, about a $495 million increase from April 2023, which is shy of $3.8 billion.
Australia Post’s 2024 eCommerce insights reported that online consumers are shopping more often, spending roughly $63.6 billion on eCommerce products and checking out an average basket size of $98.10, a -4.6% decrease YOY.
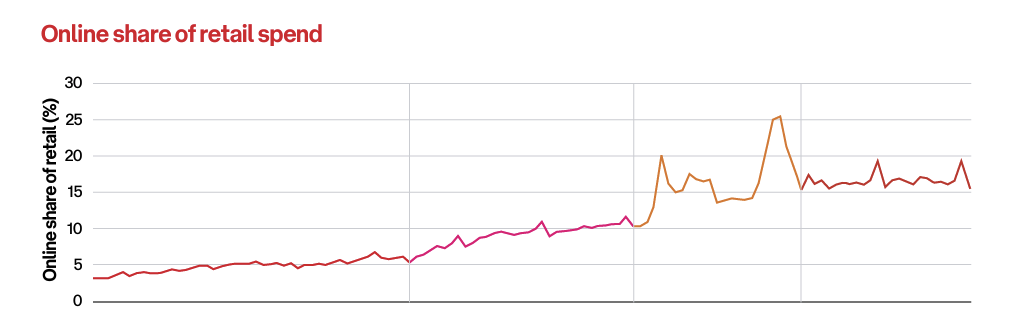
It’s also evident that we’ve adapted to a new normal by keeping our online shopping habits, which may have been reinforced and developed during the COVID-19 pandemic. Online retail accounts for 16.8% of total spending, a 68% increase from pre-pandemic figures of roughly 10%.
Source: AusPost eCommerce Report
Gen Y shoppers remain record spenders with total online spending of $22.1 billion, a -2% drop YOY with an average basket price of $95 (-6% YOY).
Gen X came second with a total spending of $17.5 billion, a 1% YOY increase. Despite a second-highest total spending, they hold the highest average basket spending of $110, albeit at a -5% YOY drop.
As a slowly adapting generation with great buying power, Baby Boomers rank third with $12.5 billion in total e-commerce spending. It doesn’t look much compared to the above generations, but Baby Boomers have the highest YOY increase at 7%, making them catch up fast with the other generations.
The digital natives, Gen Z, showed an interesting behaviour compared with the other generations. They generated the lowest total spending at $10.6 billion, which is easily explained by their career stages at their age and lower buying power.
However, Gen Z spending recorded a -11% YOY drop. While this doesn’t outright suggest a slowdown in retail spending, it could imply that Gen Z shoppers are exploring physical purchases and other eCommerce alternatives.
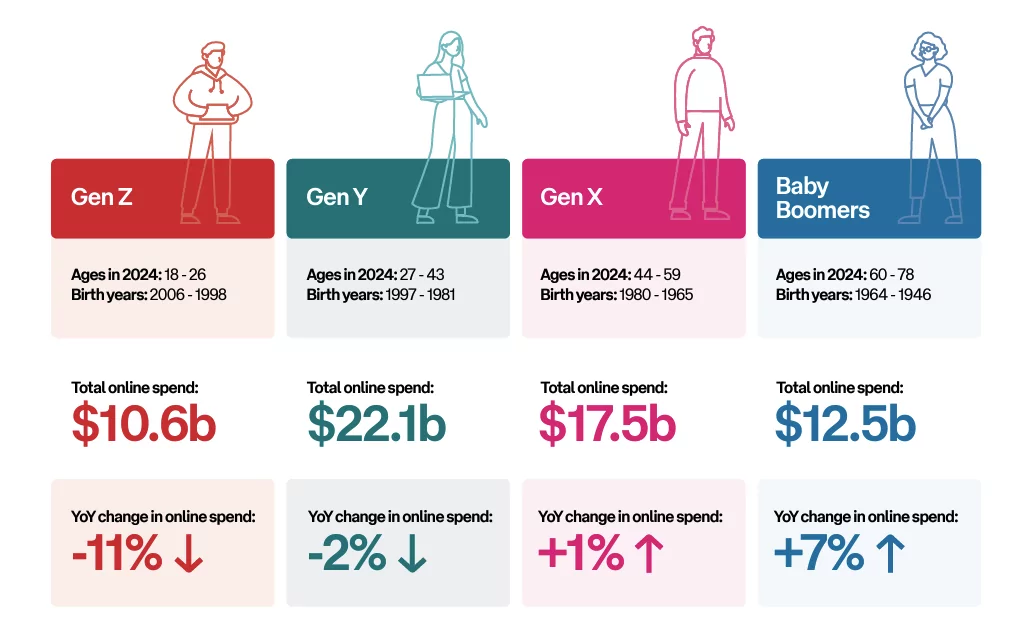
Source: AusPost eCommerce Report 2024
Western Australian consumers also spend more than any other state, ranking first with 5.1% YOY growth in online purchases. On the other hand, the Northern Territory ranked second, with a 4.6% growth in eCommerce spending.
At such record-high figures, businesses expect the Australian eCommerce market to grow throughout the coming months and peak during the holiday seasons.
Where Do Aussies Spend Their Money?
For the same period, electronics sales garnered AU$9.66 billion (+7.2% YOY), while food retail generated AU$6.50 billion (+5.7% YOY). Aussies also spent about AU$3.02 billion on DIY products and AU$5.11 billion on beverages.
Consumers spent more than $2.95 billion on furniture, about $1.28 billion for physical media (CDs, Albums, etc.), and $2.57 billion on beauty & personal care.
Here is a breakdown of year-on-year (YOY) changes in the said categories:
- Furniture: +21.9% (+529.2 million)
- Fashion: +14.8% (+$1.4 billion)
- Beverages: +7.6% (+362.88 million)
- Electronics: +7.2% (+$650.16 million)
- Food: +5.7% (+$347.76 million)
- Toys, DIY, hobby: +4.1% (+$45.36 million)
- Personal & household care: (unchanged)
- Physical media: -8.1% (-$90 million)
Australians Buying Frequency Increases
A recent eCommerce behaviour study found that Australians shop online more frequently. Australia Post recorded that about 1 in 7 households have purchased something online every week, describing the importance of eCommerce in our daily lives.
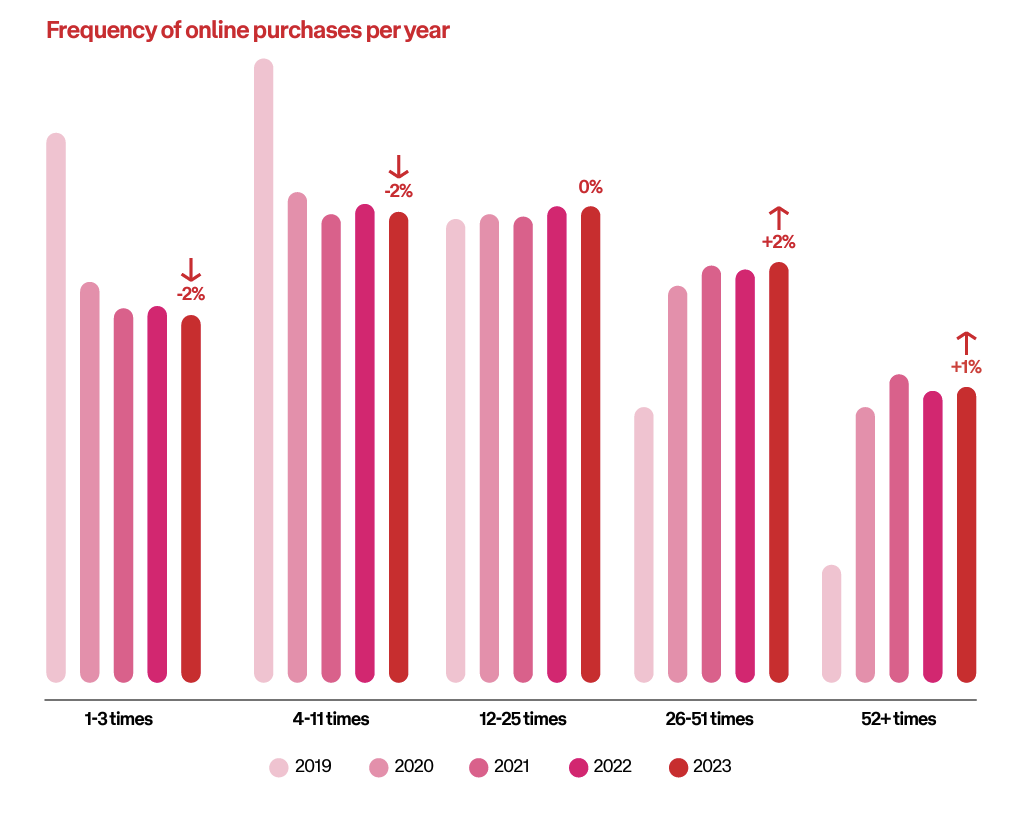
Source: AusPost eCommerce Report 2024
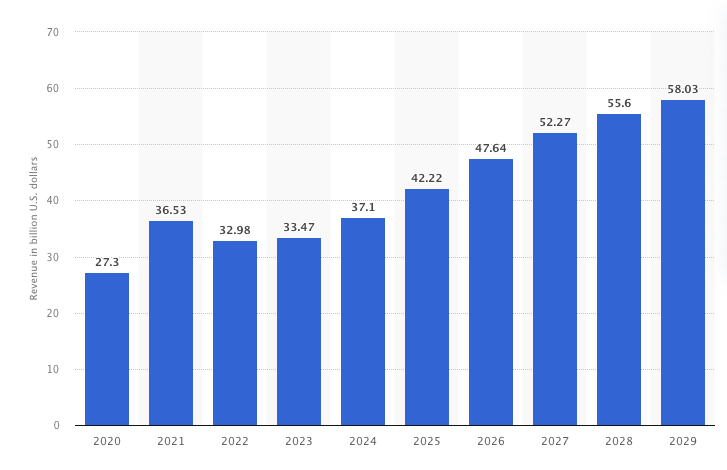
In 2023 and 2024, Australians witnessed the economy’s slow yet consistent recovery, as eCommerce spending seems to have stabilised in the last 2 years.
The latest Online and Retail Purchase study found that retail spending increased from AU$353 billion to AU$361 billion, while eCommerce purchases slightly dropped from AU$63.8 billion to AU$63.6 billion.
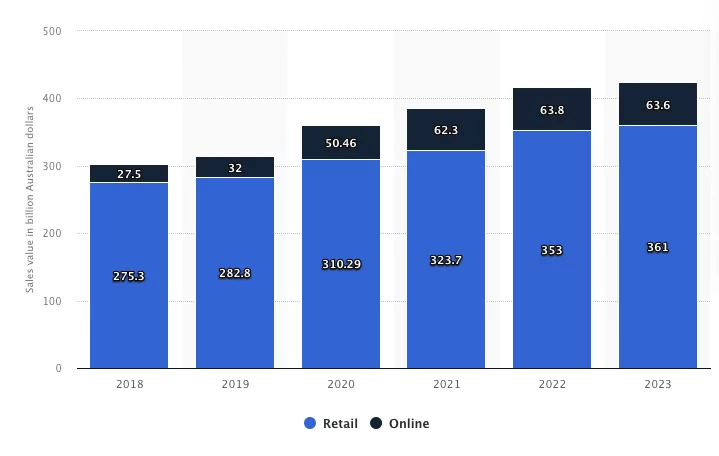
Source: Statista
Australian eCommerce Behaviour Statistics
The latest Global Digital Insights for Australia described how Aussies use and consume eCommerce platforms and services. Over half (52.8%) of Australians purchase a product or availed of a service weekly online. About 1 in 5 (23.1%) of users go online to shop for groceries and fresh produce in an eCommerce store.
Moreover, 11.6% of users have bought a second-hand item online, while almost 20% (19.5%) have used an online price comparison service to check a product’s price online to either prepare to buy it physically or while checking out the item in a physical store.
Within any average given week, 13.5% of shoppers have used a buy now pay later (BNPL) service.
Sustainability is a Need for eCommerce in 2024
Australians expect industry leaders to take action toward corporate action and sustainability.
A KPMG study on the Australian retail outlook showed that 67% of users will buy from businesses that go beyond sustainability and actually take action and accountability in reversing ecological damage to the environment. Three in four consumers have also participated in a circular economy, having bought second-hand clothes and filled their wardrobes with pre-loved clothing.
About 77% of consumers also look into sustainability elements when shopping online and want brands to communicate their sustainability initiatives more. Industry trends are shifting towards sustainable packaging and eco-friendly product materials.
To become a sustainable business, Australia Post recommends:
- Creating and sharing your brand’s sustainability goals
- Delivering on your brand commitments
- Offering sustainable delivery options and packaging
Artificial Intelligence in eCommerce
According to UppercutSEO, as artificial intelligence finds its way into developing digital twins, IoT systems, optimisation, logistics management, and other similar technologies, eCommerce is also starting to embrace AI technology in its workforce.
Data and digital expert Renaud Frisé describes that AI will sift through historical sales data, analyse real-time KPIs, consumer impressions, and market trends, and incorporate weather conditions, local events, traffic, and other factors that may impact demand and logistics.
As of 2024, 19% of retailers believe AI can be a big growth driver for the year. This puts early movers for AI at an advantage, allowing them to get ahead and figure it out ahead of time to incorporate AI into the eCommerce landscape seamlessly.
Leading eCommerce Payment Methods
Secure online and hassle-free payment solutions streamline user purchases and positively impact your brand’s eCommerce capabilities. Over the past year, 31% of Aussies pay using e-wallets, while 41% pay using debit and credit cards. Only 10% prefer bank transfers, while 1% of customers choose cash-based payments.
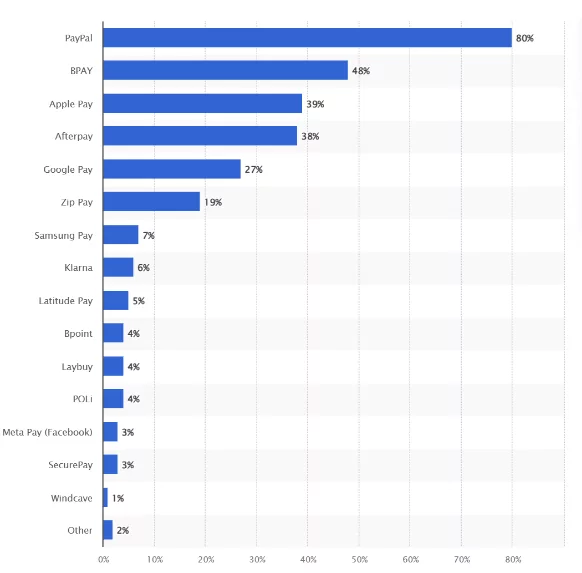
As of March 2024, 80% of consumers have used PayPal as a primary digital payment service, followed by BPAY at 48%, Apple Pay at 39%, AfterPay at 38%, and Google Pay at 27%.
SecurePay(3%) and Windcave (1%) were the least popular payment solutions.
Source: Statista
Final Thoughts
Australia’s eCommerce landscape in 2025 is on its way toward post-pandemic recovery and stabilising towards the new normal. We’re witnessing the expected rise in sales paired with diverse consumer behaviour. Despite the predicted economic downturn, many shoppers are willing to shop at their favourite eCommerce brands and return frequently.
It’s no secret that Australian consumers are quicker to adopt new digital payment methods and that eCommerce adoption will continue to grow in the long run despite the economic slowdown.
At Red Search, we’re an experienced SEO agency in Sydney specialising in growing online brands through bespoke eCommerce SEO services. Contact us to speak with our senior SEO consultants today.
For more on Australian statistics, see our other articles:
Frequently Asked Questions
1. How large is the global eCommerce market in 2025?
The global eCommerce market is forecasted to reach a total market value of up to $4.8 trillion in 2025. We expect this figure to grow over the upcoming years as borderless eCommerce becomes an increasingly profitable option for online retail brands.
About 23% of all retail purchases will occur online in 2027, a roughly 2.9% increase from 2024—showing an increasing preference for online shopping.
2. What is the projected growth rate for eCommerce?
With the e-commerce market estimated to grow to $9 trillion by 2032, we see projected growth rates of up to 7% between 2024 and 2027. Such growth offers more opportunities for e-commerce brands to expand globally.
3. How many online shoppers will there be worldwide?
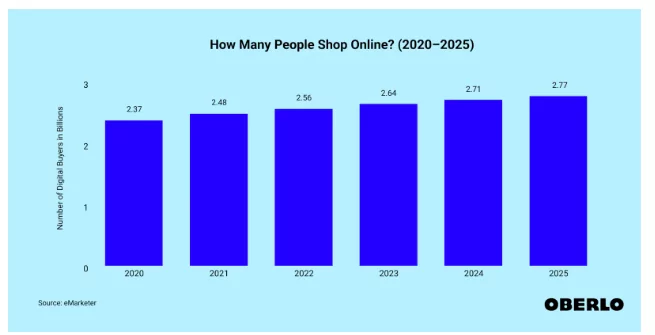
In 2024, roughly 2.71 billion digital buyers populated the eCommerce landscape—a whopping 33% of the global population. The population of online shoppers consistently grew over the past years, with a 2.7% year-over-year increase in 2024 as 70 million more shoppers entered the market.
4. Which regions dominate the global eCommerce market?
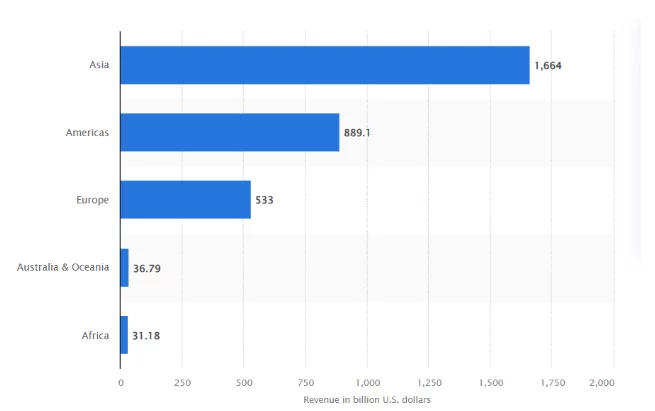
Asia currently leads the global eCommerce market with a total revenue of roughly US$1.7 trillion in 2023, about $775 billion more than the Americas, with $890 billion in revenue.
Regions like Europe, Australia, Oceania, and Africa recorded far lower e-commerce revenues. Europe’s figure was decent at $533 billion, while Australia’s and Oceania’s were only $36.8 billion and $31.18 billion, respectively.
- Latin America expects a 22% growth from 2023 to 2026, accounting for more than $700 billion in combined eCommerce sales.
- The Philippines is the fastest-growing online retail market in the world, with a 24.1% revenue growth in 2023. As a Southeast Asian country on track to become an upper-middle-class country by 2025, its shoppers have more disposable incomes, likely resulting in increased consumer spending.
About 42% of Americans reported planning to spend more online over the next year, indicating a population with an increased preference for online retail and eCommerce.
5. What are the top eCommerce platforms?
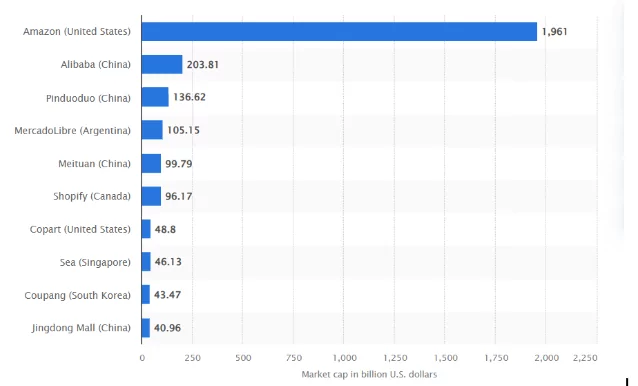
- Amazon remains the top eCommerce platform as of September 2024, accounting for US$1.961 trillion in market cap—a whopping 70.5% market share.
- Alibaba/Taobao holds about 7.33% of the global eCommerce market, showing a strong influence over the Chinese market.
- Shopify has the sixth-biggest market share, at US$96.17 billion, and a roughly 3.5% market share.
- Others, such as MercadoLibre in Argentina, Sea in Singapore, Coupang in South Korea, and other China-based eCommerce platforms, also appear on the list, collectively accounting for the remaining 18.67%.
Source: Statista
6. What percentage of eCommerce sales will be via mobile devices?
Mobile devices dominate eCommerce traffic globally and contribute to many online sales. As of Q3 2024, smartphones account for 77% of traffic for rental sites worldwide, while 68% of purchases from online retailers were made via mobile devices.
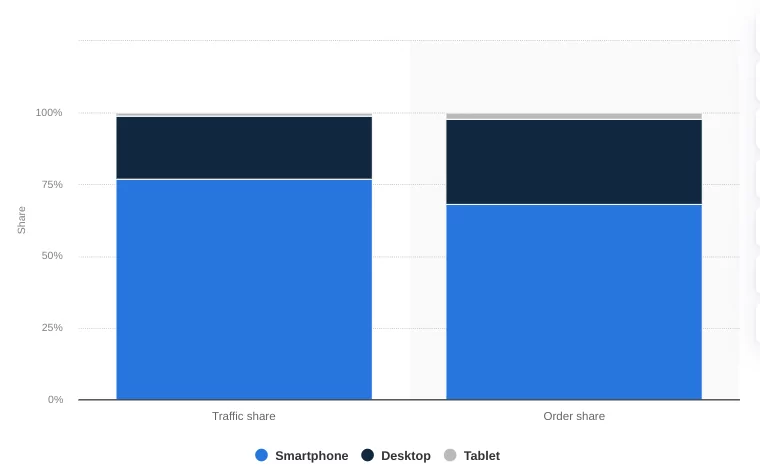
Source: Statista
7. What is the average conversion rate for eCommerce websites?
As of September 2024, the average eCommerce conversion rate is 1.78%, after a third consecutive drop since June 2024.
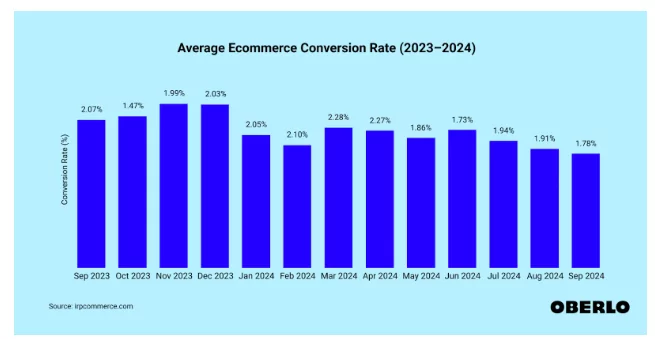
Source: Oberlo
This is the lowest recorded eCommerce conversion rate in one year, as the highest conversion rate, 2.03%, came from November to December 2023. That was a direct result of the year-end holiday season, the biggest and busiest shopping event.
8. How much do consumers spend on online shopping annually?
As of 2024, consumers have spent a total of US$6.33 trillion in online retail purchases. That figure is estimated to grow by $1.7 trillion by 2027 as revenue reaches $8.034 trillion.
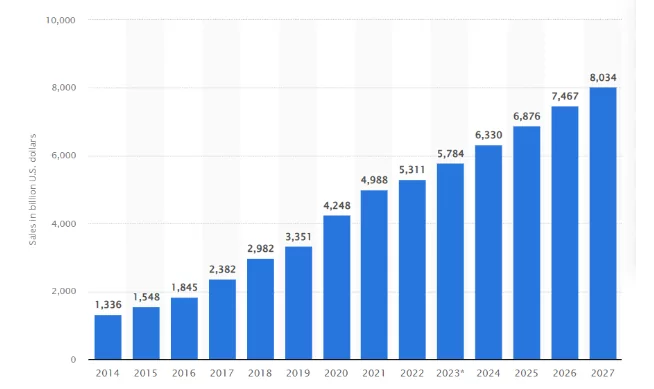
Source: Statista
9. What are the top product categories in eCommerce?
In Australia, the most popular consumer goods categories in eCommerce include:
- Fashion: AU$7.7 billion in sales and a 14.8% YOY increase
- Electronics: $6.39 billion in revenue, with a 7.2% YOY increase
- Food: $4.30 billion in sales, +5.7% YOY change
- Beverages: $3.38 billion in sales, +7.6% YOY change
- DIY & Hardware: $2 billion in sales, -6.1% YOY change
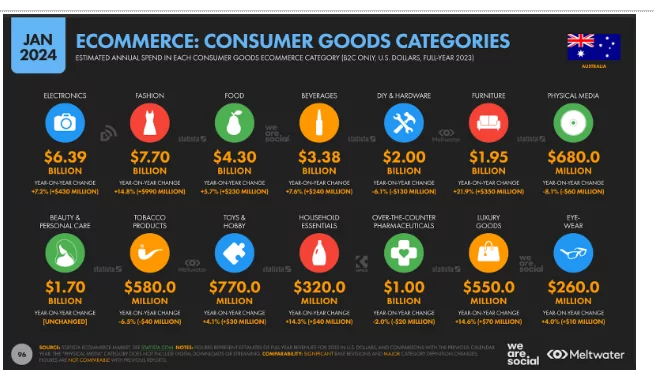
Source: Global Digital Reports
10. Which payment methods are most popular when transacting online?
As of January 2024, here are the most popular payment methods used for eCommerce in Australia:
- Debit & Credit Cards: 41.0%
- Digital & Mobile Wallets: 31.0%
- Bank Transfers: 10.0%
- Cash-on-Delivery: 1%
- Other payment methods (e.g. cryptocurrencies): 17%
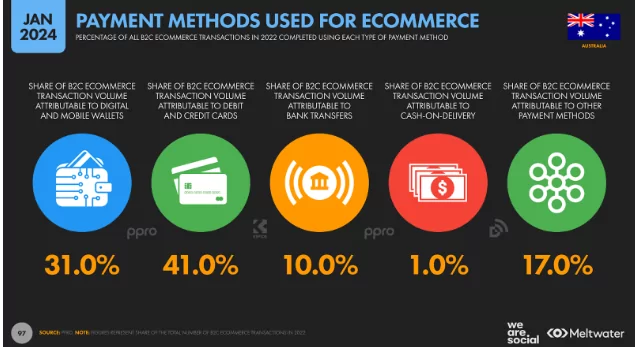
Source: Global Digital Reports
11. What is the impact of social commerce?
With platforms like Instagram, Facebook, TikTok, and Pinterest playing vital roles in driving social commerce sales, the market is expected to reach US$2.22 trillion in 2025, a consistent growth from about $1.70 trillion.
These figures are driven by integrated shopping features on social media platforms, allowing shoppers to purchase goods directly and conveniently from the app.
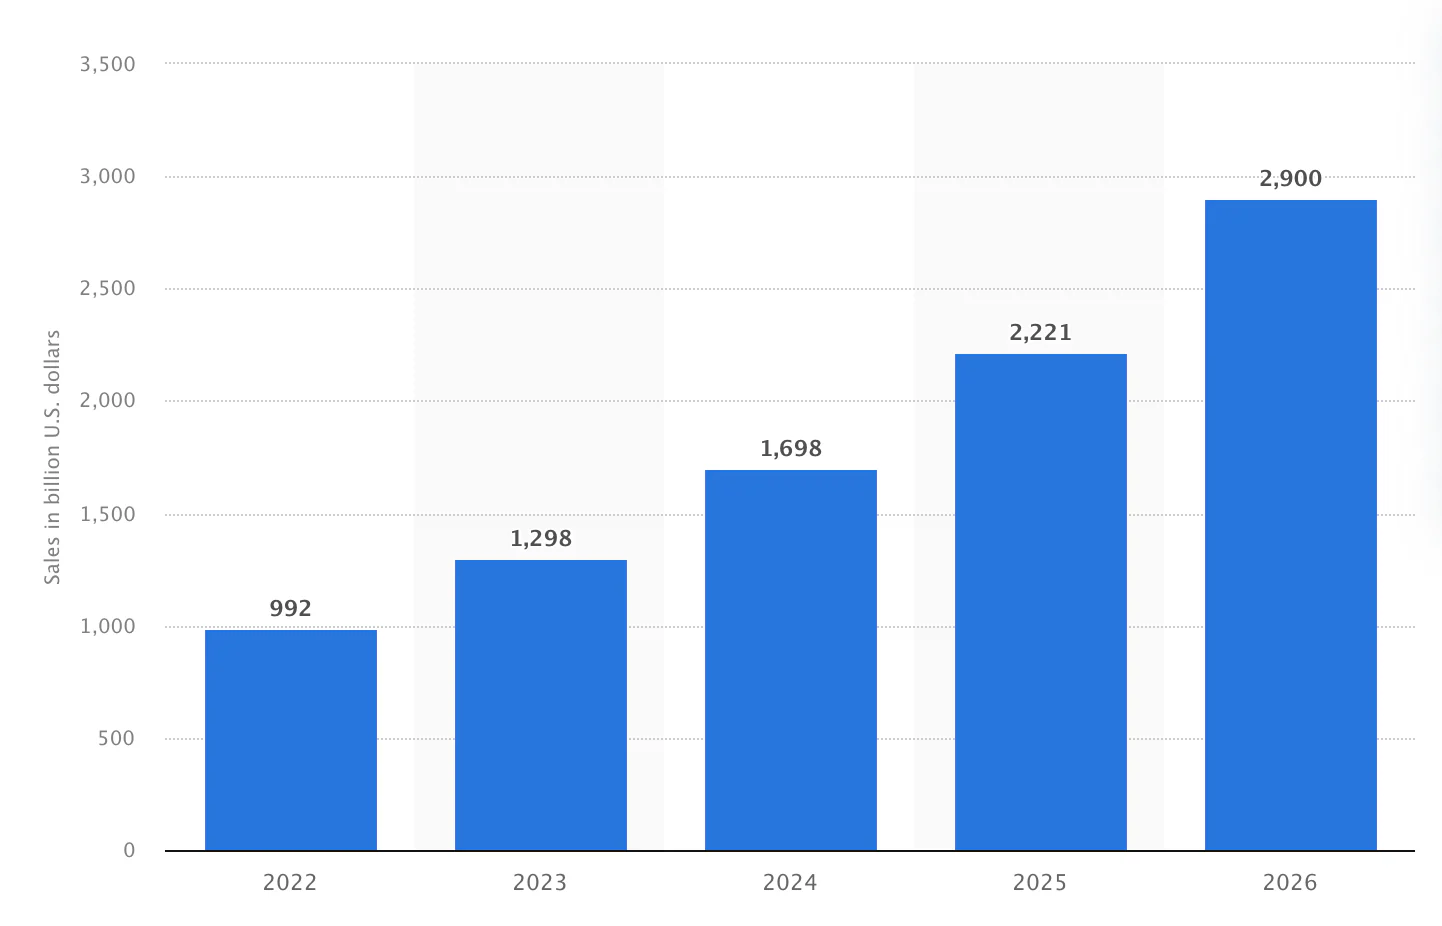
Source: Shopify
12. How significant is cross-border eCommerce?
Cross-border eCommerce accounts for over 20% of the total eCommerce revenue worldwide, reaching up to $1 trillion in revenue.
As of 2024, China leads the cross-border eCommerce market, with more than 40% of all cross-border transactions coming from online retailers in Asia.
13. How have Augmented Reality (AR) and Virtual Reality (VR) evolved in e-commerce?
AR and VR adoption led to significant growth in conversion rates for online stores, leading to a 20% uptick in customer engagement and conversion. Interactive and three-dimensional engagement with VR immersion also led to a 30% rise in customer satisfaction.
Moreover, eCommerce platforms utilising AR & VR immersion reported up to 40% growth in sales, emphasising that these technologies are far more than simple novelties and are effective tools in customer satisfaction by improving product visualisation.
14. How has the average order value (AOV) changed?
The average order value recently had notable highs and lows, recording a 4.9% annual decrease as of July 2024 at AU$191.82. Food and drinks were among the top contributing product categories, along with cars and motorcycling and electrical and commercial equipment.
In terms of checkout values, luxury and jewellery had the highest AOV by industry, followed by home, furniture, and consumer goods.
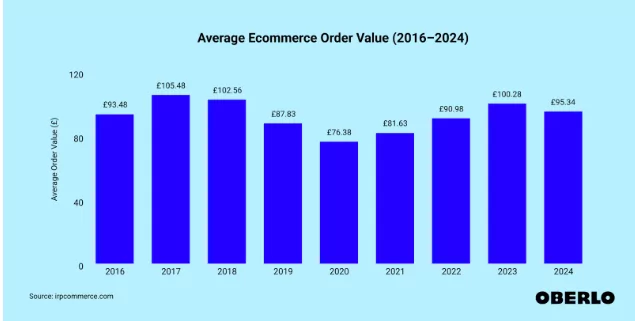
Source: Oberlo